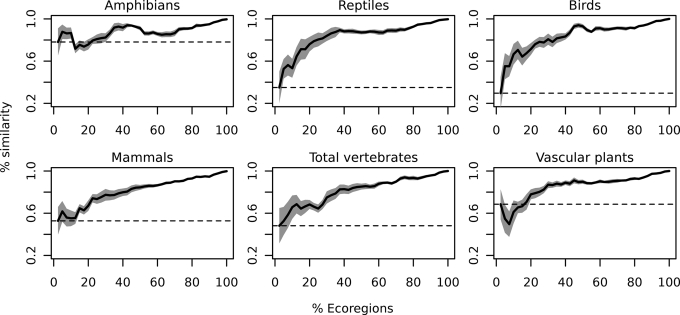
Fig. 2.
Relationship between the criterion used to define hotspots (% of ecoregions) and the similarity between hotspots identified assuming a power SAR and those identified when using multimodel SARs. The percentage similarity among the two methods was determined as the number of ecoregions identified as hotspots by both, divided by the total number of ecoregions in a group. For example, the highest 2.5% of ranks in a dataset consisting of 200 ecoregions comprises five ecoregions. If three ecoregions occur in the two groups, then the percentage similarity among the two methods is 60%. Dark plain line represents mean percentage similarity averaged across biomes for each higher taxon, gray polygon is the associated standard error of the mean, and dashed horizontal line indicates the percentage similarity at the 2.5% cut-off.

