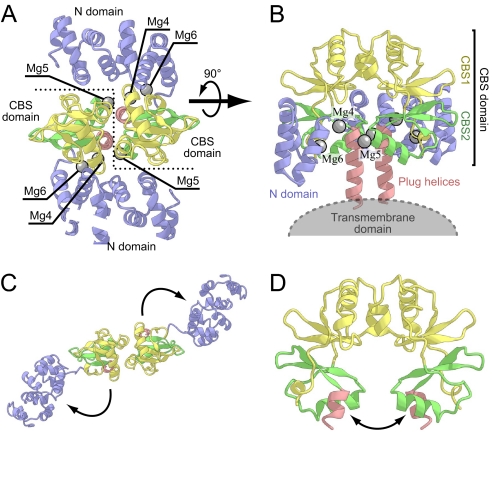
Fig. 1.
Crystal structure of the MgtE cytosolic domain (PDB ID code 2YVY) used as the initial structure for the simulations. Protein backbones are depicted by ribbon models. The N domain, CBS1, CBS2, and the plug helix are colored blue, yellow, green, and red, respectively. Mg2+ ions (Mg4, Mg5, and Mg6) investigated in the present simulations are shown as gray spheres. (A) View from the intracellular region. The boundary of the subunits is indicated by a dashed line. (B) View in the plane of the membrane. Part of the N domain (1–88) of molecule B is not shown. (C and D) The crystal structure of the MgtE cytosolic domain under the Mg2+-free conditions viewed from the same directions as in A and B, respectively. The directions of the observed structural change are designated by arrows. This figure and the other figures were generated with the programs CueMol (http://www.cuemol.org/) and Warabi (http://park11.wakwak.com/∼warabiya/).

