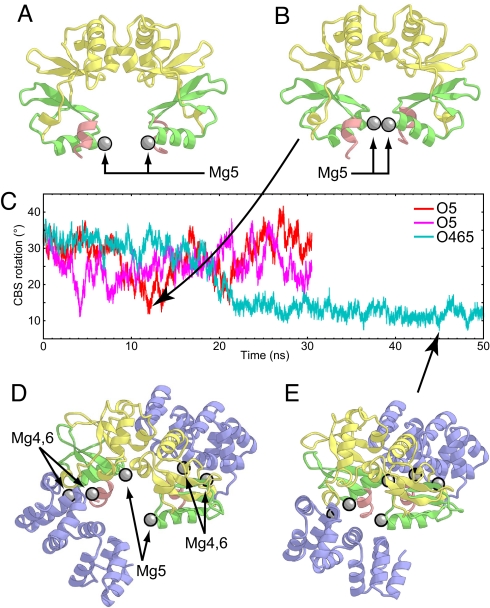
Fig. 4.
The open-to-closed form structural changes observed in the simulations. (A and B) The initial structure (A) and the most closed structure at 11.574 ns (B) in the O5 simulation viewed in the plane of the membrane. The protein backbones are depicted by ribbon models, with the same coloring scheme as in Fig. 1. Mg2+ ions are shown as gray spheres. (C) CBS rotation as a function of time during the two O5 (red and magenta) and O465 (cyan) simulations. (D and E) The initial structure (D) and the most closed structure at 44.912 ns (E) in the O465 simulation viewed from the intracellular region. The protein backbones are depicted by ribbon models, with the same coloring scheme as in Fig. 1. Mg2+ ions are shown as gray spheres.

