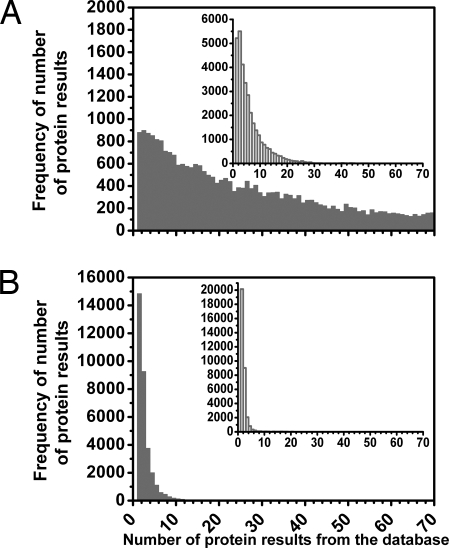
Fig. 1.
Histograms demonstrating the feasibility of identifying proteins by using their amino acid/CH3 ratios. Tests were performed over our human proteome database; amino acid/CH3 ratios and their precisions were used as search parameters for each protein in the database. The horizontal axes correspond to the number of protein outputs from the database when a search was performed for a protein. The vertical axes represent the frequency with which a particular number of hits were output when the search was performed for each protein of the database (≈33,000) in turn. (A) Shown is the number of hits output from the database when the three amino acid/CH3 ratios studied experimentally for this article (Tyr/CH3, Trp/CH3, and Phe/CH3) were input with 10% precision for each protein. (B) Shown is the number of protein hits returned when the database search was extended to using five amino acid ratios (by also using the His/CH3 and Cys/CH3 ratios). (Inset) Histograms show the results for when the molecular weight (with 10% precision) was also included as a search parameter. The first bar of B shows that ≈15,000 proteins of the ≈33,000 present in the database (≈44%) gave only one hit and thus were uniquely identifiable. The second bar shows that ≈9,000 proteins gave two protein hits and so could be one of only two possible database candidates. When the molecular weight was also used as a parameter, ≈20,000 (≈60%) of the proteins were unambiguously identified.

