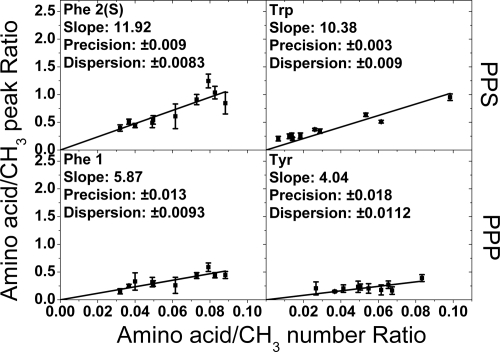
Fig. 4.
Measured ratios of amino acid peak intensity to internal reference intensity plotted against the known ratios for the four identified amino acid peaks used experimentally in this study. Each data point comes from one of the 10 protein species analyzed. The solid lines are the linear fits constrained through the origin, and the error bars are standard deviations from four repeat measurements. The calculated average precisions on the amino acid/CH3 ratios were deduced from the average experimental error bars and are denoted “Precision” on the graphs. The horizontal dispersions of the data points compared with the linear fits are the average absolute differences and are denoted “Dispersion.” This is essentially the standard deviation due to variation of the individual protein points from the linear fit. For the case of tryptophan, where the dispersion is greater than the precision, the implication is that there is some residual structural effect influencing the cross-peak intensity.

