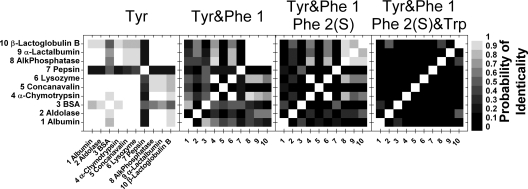
Fig. 6.
Differentiation maps of the 10 proteins for combinations of the amino acid peaks (with 120 s acquisition time per amino acid cross-peak). White corresponds to 1 (proteins are completely indistinguishable) and black to 0 (proteins are completely distinguishable). The gray level of each square corresponds to the probability that the two proteins being compared are the same protein (see scale).

