
Figure 5.
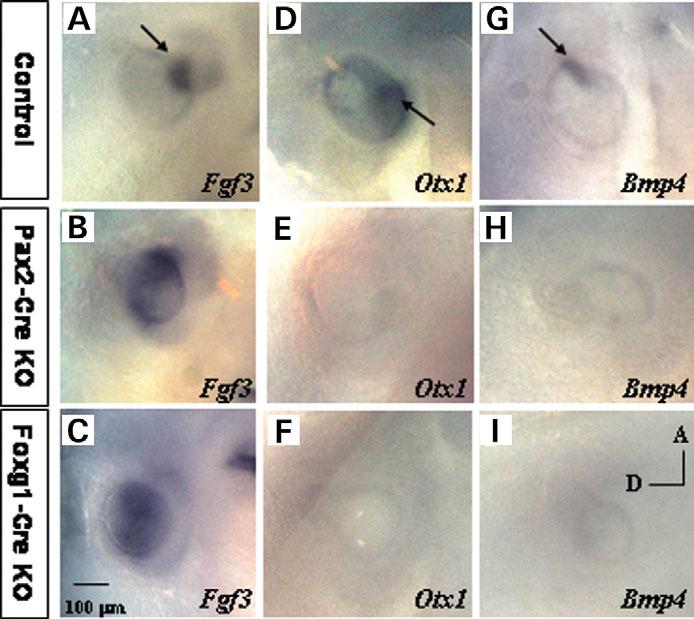
Molecular marker analysis by ISH. Fgf3 expression in control (A), Foxg1-Cre (B) and Pax2-Cre (C) mutant embryos at E10.5. Expression of Otx1 in E10.5 control (D), Foxg1-Cre (E) and Pax2-Cre (F) mutant embryos. Bmp4 expression in control (G), Foxg1-Cre (H) and Pax2-Cre mutant embryos (I). Control, Tbx1+/−, Foxg1-Cre KO, Tbx1 null/flox; Foxg1-Cre/+, Pax2-Cre KO, Tbx1 null/flox; Pax2-Cre tg.