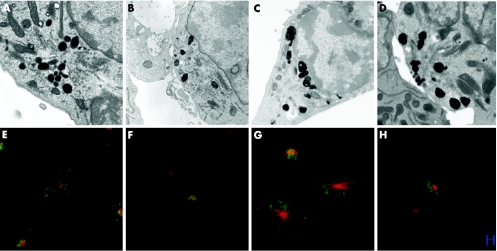
Figure 4 Granule polarisation in control and patients with FHL3. Electron microscopy (A–D) and confocal microscopy (E–H) of control (A, B, E, F) and FHL3 (C, D, G, H) cytotoxic T lymphocyte (CTL). Single CTL (A, E, C, G) shows granules distributed throughout the cells and CTL conjugated to target cells (B, F, D, H). FHL3 cells from patients 7 (C, D) and 9 (G, H). Scale bar = 10μm. Tubulin (red), lamp (green).

An official website of the United States government
Here's how you know
Official websites use .gov
A
.gov website belongs to an official
government organization in the United States.
Secure .gov websites use HTTPS
A lock (
) or https:// means you've safely
connected to the .gov website. Share sensitive
information only on official, secure websites.
