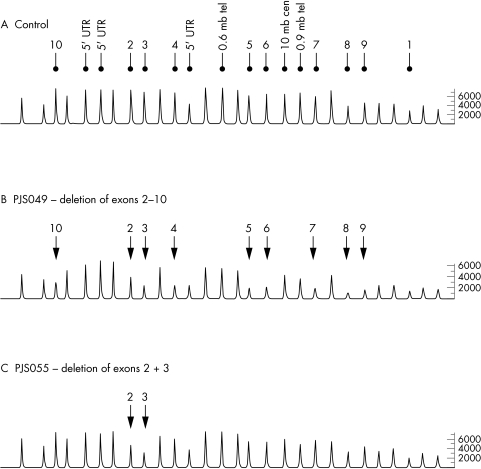
Figure 1 Representative chromatograms from MLPA analysis of STK11. (A) Control individual with peaks corresponding to exonic and 5′ UTR probes; probes hybridising to flanking regions of STK11 are indicated. All other peaks correspond to control probe signals. (B) Chromatogram from PJS patient PJS 049 showing the relative reduction in peak area of probes hybridising to exons 2–10 of STK11. (C) Chromatogram from PJS patient PJS 055 showing the relative reduction in peak area of probes hybridising to exons 2 and 3 of STK11.

An official website of the United States government
Here's how you know
Official websites use .gov
A
.gov website belongs to an official
government organization in the United States.
Secure .gov websites use HTTPS
A lock (
) or https:// means you've safely
connected to the .gov website. Share sensitive
information only on official, secure websites.
