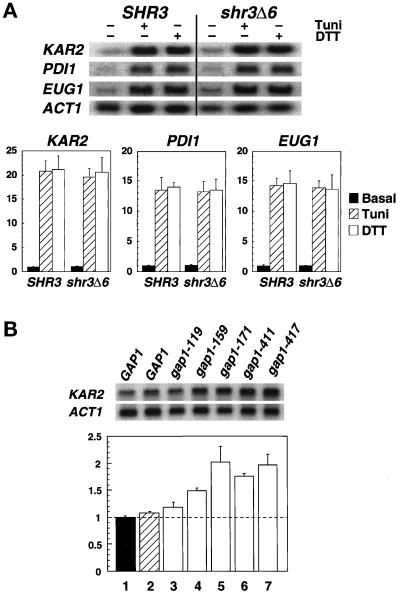
Figure 2.
Transcription levels of ER stress response proteins in SHR3 and shr3Δ6 strains. (A) Total RNA preparations (5 μg) isolated from cultures of FGY58 (SHR3) and FGY60 (shr3Δ6) transformed with pPL257 (GAP1) were separated by gel electrophoresis, transferred to nylon filters, and hybridized with radiolabeled DNA probes specific for KAR2, PDI1, EUG1, and ACT1. Cultures were grown at 30°C for 2.5 h in SUD in the absence or presence of 4 μg/ml tunicamycin (Tuni) or 3 mM DTT. Phosphorimager quantitations from two independent experiments are presented as ratios of basal transcription levels with respect to the SHR3 strain (FGY58) normalized to 1; error bars represent 1 standard deviation. (B) The stress response pathway is induced in strains expressing mutant alleles of gap1. Cultures of strains FGY58 (SHR3) transformed with plasmid pPL257 (GAP1, black bar, lane 1) and FGY60 (shr3Δ6) transformed with plasmids pPL257 (GAP1, hatched bar, lane 2), pFG80 (gap1–119), pFG81 (gap1–159), pFG82 (gap1–171), pFG83 (gap1–411), and pFG84 (gap1–417) (white bars, lanes 3–7, respectively) were grown at 30°C for 4 h in SPD (plus adenine and lysine). RNA was isolated and analyzed using radiolabeled DNA probes specific for KAR2 and ACT1. Phosphorimager quantitations from three independent experiments are presented as ratios of the transcription levels with respect to the SHR3 strain (FGY58, lane 1) normalized to 1; error bars represent 1 standard deviation.

