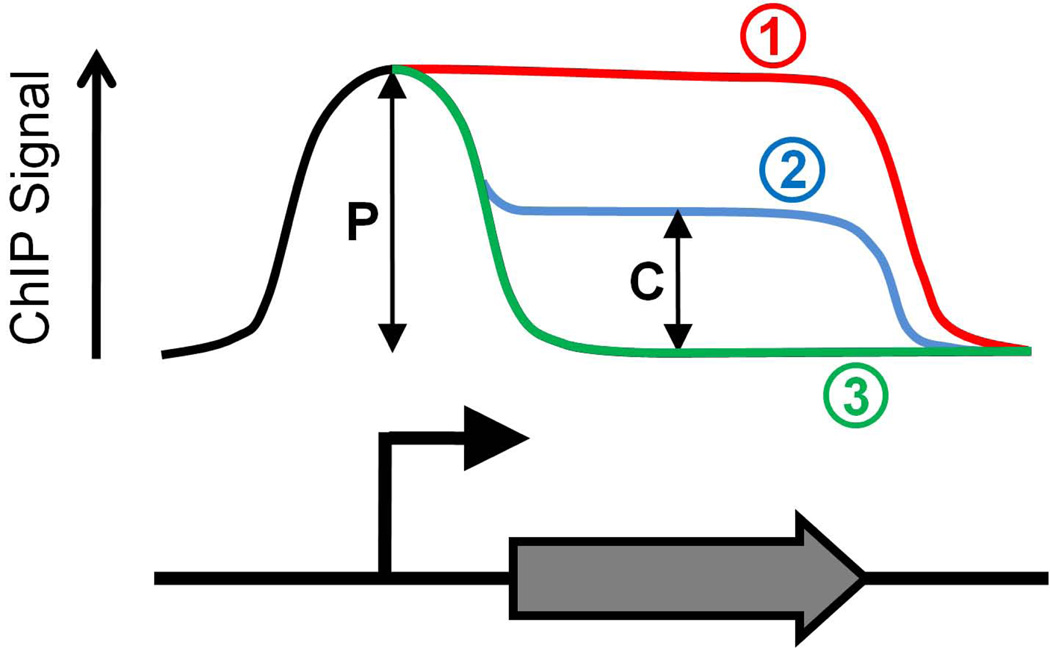
Figure 2. Possible profiles of ChIP signal for RNAP.
The graph shows 3 possible ChIP profiles for RNAP across a gene. In all cases RNAP associates with promoter DNA sequences at an equivalent level. In case (1) the ChIP signal is constant throughout the promoter and coding sequence, indicating rapid transition of RNAP from initiation to elongation. In case (2) the ChIP signal is reduced within the coding sequence as compared to the promoter, although ChIP signal in the coding sequence is above background. This indicates that some or all RNAP complexes transition slowly from initiation to elongation. As ChIP measures a population of cells it is impossible to determine whether all RNAP complexes transition at the same rate. In case (3) the ChIP signal is only present at the promoter. This indicates “poised” RNAP at the promoter, i.e. RNAP that is unable to make the transition from initiation to elongation. If the peak of RNAP ChIP signal is downstream of the transcription start site this indicates that RNAP is paused in early elongation. In all cases a Traveling Ratio (TR) can be calculated as the ratio of coding sequence signal (C) to promoter signal (P). Hence, TR can be used as an measure of the rate of transition from initiation to elongation at a given promoter.

