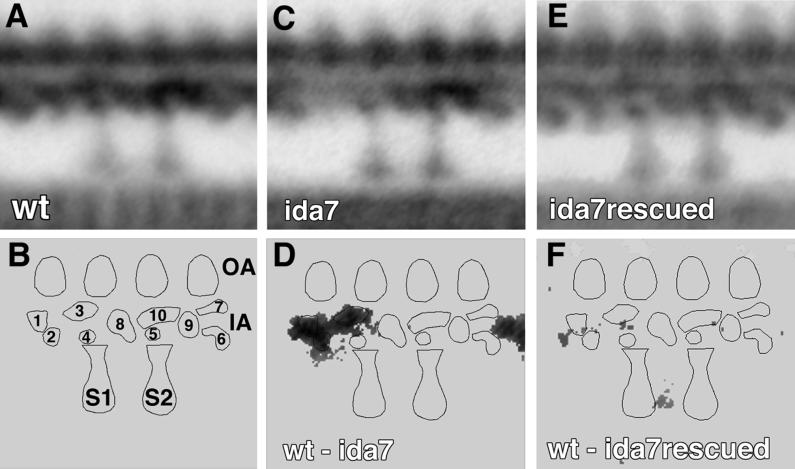
Figure 1.
Analysis of longitudinal images of axonemes isolated from wild-type, ida7, and a rescued ida7 strain (AH1). Grand averages from wild-type (A), ida7 (C), and the rescued ida7 (E) are based on 8, 8, and 9 individual axonemes and 74, 65, and 84 axoneme repeats, respectively. (B) Model of axoneme structures within the 96-nm axoneme repeat, with the major lobes of density in the inner arm region labeled 1–10. The proximal and distal radial spokes are labeled S1 and S2, respectively; the outer arms (OA) are on top, and the inner arm (IA) region is below. (D) Difference plot between wild-type and ida7, and (F) difference plot between wild-type and the rescued ida7 strain (AH1). Differences not significant at 0.005 confidence level have been set to zero.

