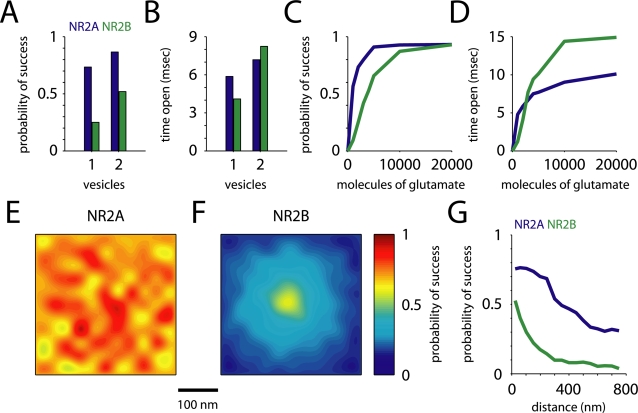
Figure 4. Spatial pattern of receptor opening.
(A,B) Probability of opening (A) for NR2B-containing NMDARs nearly doubled, while increasing only modestly for NR2A-containing NMDARs for simultaneous release of two vesicles. Average time (B) open for NR2B-containing receptors was consequently greater. (C,D) The probability of receptor opening (C) and time open (D) versus the number of glutamate molecules released from a single vesicle increased linearly for NR2B-containing NMDARs up to 5000 molecules, at which point NR2A-containing NMDARs had already began to saturate. At 3000 molecules, the total time open for NR2B- was greater than for NR2A-containing NMDARs. (E,F) NR2A-containing NMDAR success probability (A) was nearly indifferent to location, while NR2B-NMDARs (B) showed a hot spot of success probability near the site of glutamate release. (G) The decrease in success probability with distance from the site of release for both synaptic (distance from release site<250 nm) and perisynaptic receptors.

