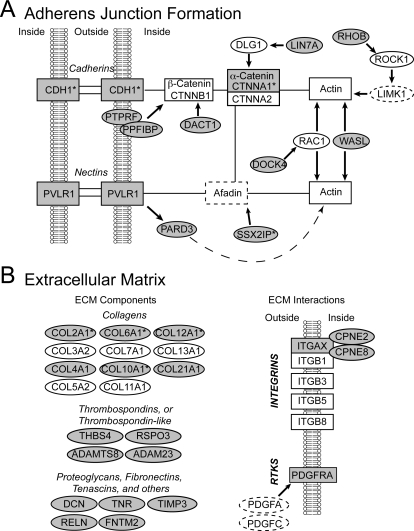
Figure 7. Networks describing the involvement of HVC markers in the formation of adherens junctions (A) and in the mediation of focal cell adhesions to the extracellular matrix (ECM) (B).
Gene abbreviations are in the text and Tables S1 and S3. Rectangles constitute central nodes with specific receptor and/or structural properties, genes in ovals play a primarily regulatory role. Arrows indicate a positive direct interaction, solid lines depict bi-directional protein-protein interactions. Not all connections and nodes are included; genes not required for network assembly, or not present on the arrays were omitted for clarity. Grey elements represent differentially expressed genes from our primary or secondary (asterisks), white symbols indicate genes that were either not differential (solid), or not on the array (dashed).

