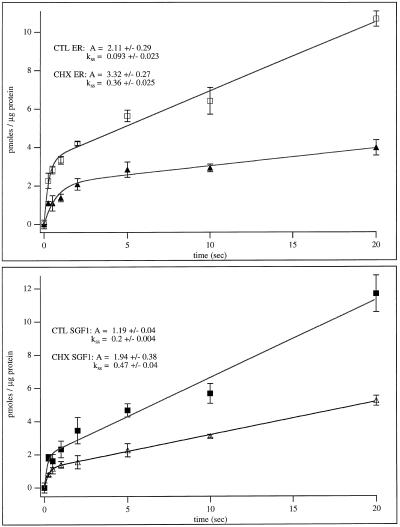
Figure 11.
Time course of calcium uptake into CTL and CHX SGF1 and ER fractions. (Upper panel) Calcium uptake versus time is plotted for CTL ER (▴) and CHX ER (□). (Lower panel) Calcium uptake (pmoles/μg of protein) versus time (seconds) is plotted for CTL SGF1 (▵) and CHX SGF1 (▪). Curves were fitted and rates were calculated by using Igor software and the formula: f(x) = A × [1 − exp(−kb × t)] + kss × t, where A is the burst amplitude, kb is the burst rate, and kss is the steady-state rate. The burst height (A) and steady-state rate of uptake (kss) for each fraction are given.

