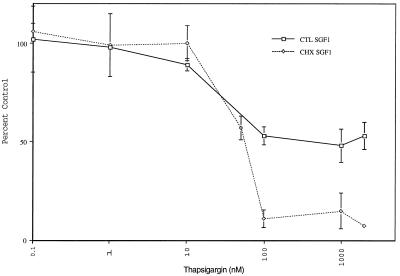
Figure 8.
Thapsigargin dose–response curves for CTL SGF1 and CHX SGF1. Calcium uptake is measured in the presence of increasing amounts of thapsigargin (0–2000 nM) for CTL SGF1 (□) and CHX SGF1 (♦). Calcium uptake is expressed as percent of control (no thapsigargin). Error bars represent SD, and n = 6.

