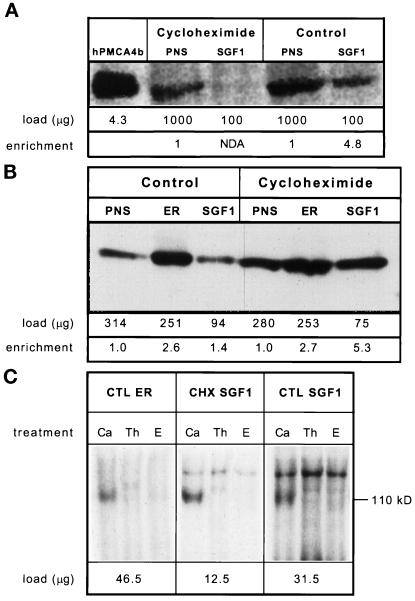
Figure 9.
Immunoblot and autophosphorylation analysis of CTL and CHX fractions. Samples of each fraction were solubilized in SDS-PAGE sample buffer at room temperature for 1 h before running on a 5–15% polyacrylamide gel and transfer to Immobilon-P. The sample size was optimized for each fraction and the protein loaded per lane is given directly below each lane. Signal was detected with 125I-labeled protein A and quantitated by using a PhosphorImager and reported in PI units. Enrichment was calculated as (sample PI units/μg of protein)/(PNS PI units/μg of protein) and is given at the bottom of the figure. Shown is an autoradiograph of the same immunoblot. (A) PMCA analysis by immunoblotting: lane 1, COS microsomes overexpressing hPMCA4b; lane 2, CHX PNS; lane 3, CHX SGF1; lane 4, CTL PNS; lane 5, CTL SGF1. (B) SERCA analysis: lane 1, CTL PNS; lane 2, CTL ER; lane 3, CTL SGF1; lane 4, CHX PNS; lane 5, CHX ER; lane 6, CHX SGF1. NDA is defined as an enrichment of less than 0.5. (C) Calcium-dependent autophosphorylation of fractions. CTL ER (left), CHX SGF1 (middle), and CTL SGF1 (right) were incubated with [γ-32P]ATP. The sample size was optimized for each fraction and the protein per reaction is given below the autoradiograph. Reactions were carried out in the presence of 100 μM calcium (Ca), 2 μM thapsigargin (Th), or 1 mM EGTA (E) for 15 s on ice and processed as described in MATERIALS AND METHODS. The molecular mass of SERCA (110 kDa) is shown on the right. This was the only band phosphorylated in a calcium-stimulated and an EGTA-inhibited manner.

