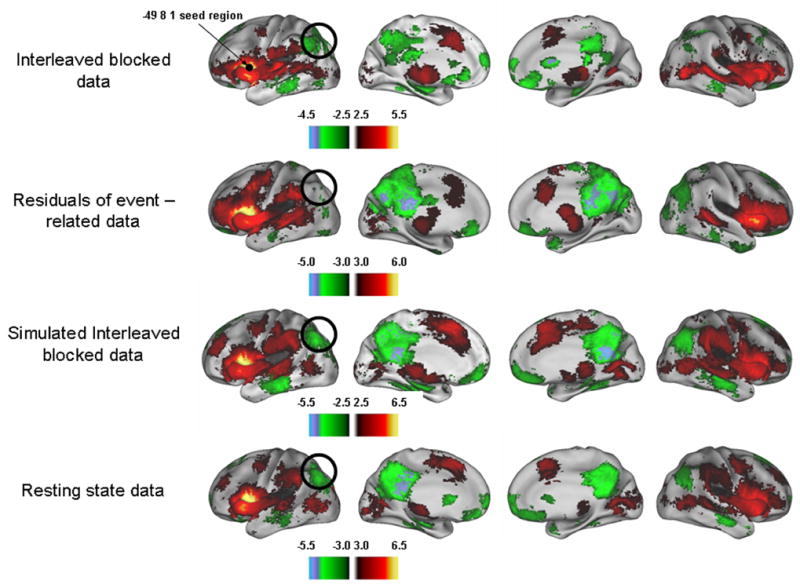
Figure 2.

Random effects analyses provided qualitative comparisons between all data sets for each seed. Z-score maps of a sample seed region (−49, 8, 1) are provided here. Similar correlation profiles were observed across all data types; however, distinct differences were evident. Correlation coefficients tended to be slightly decreased in the interleaved data and the simulated interleaved data compared to the resting state data, yet few overt differences were seen (black circles), as was the case with the event-related data.
