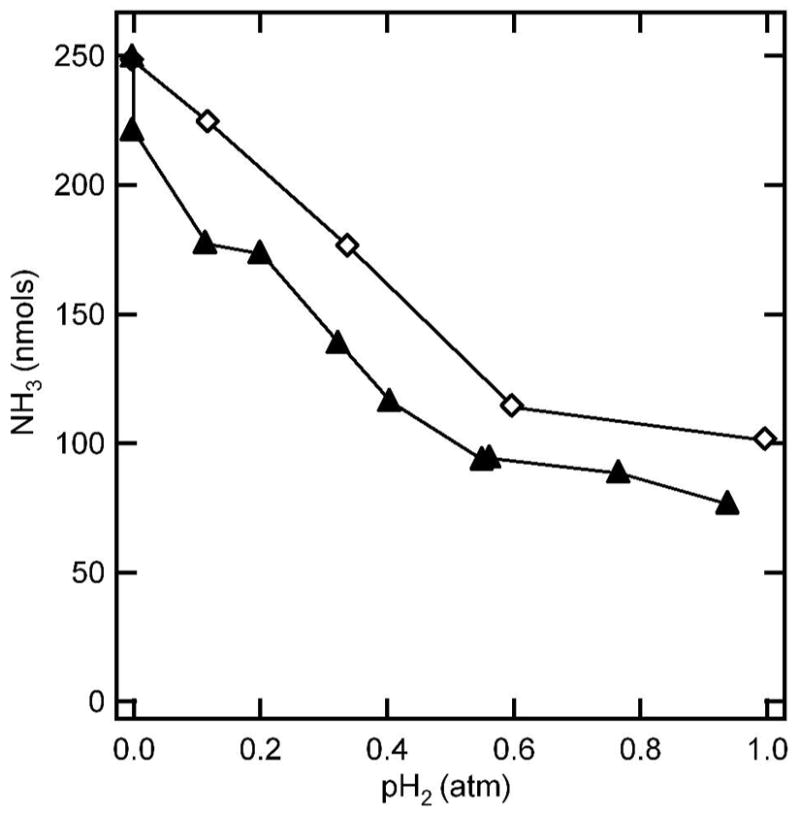
Figure 4. Hydrogen inhibition of diazene and nitrogen reduction.

The quantity of amnmonia detected after 5 min of turnover under N2 (▲) or diazene (◇) is shown as a function of the partial pressure of H2 (pH2) with Ar as the supplementary gas. Assay conditions were as described in the legend to Figure 3.
