
Figure 9. ENDOR spectra.
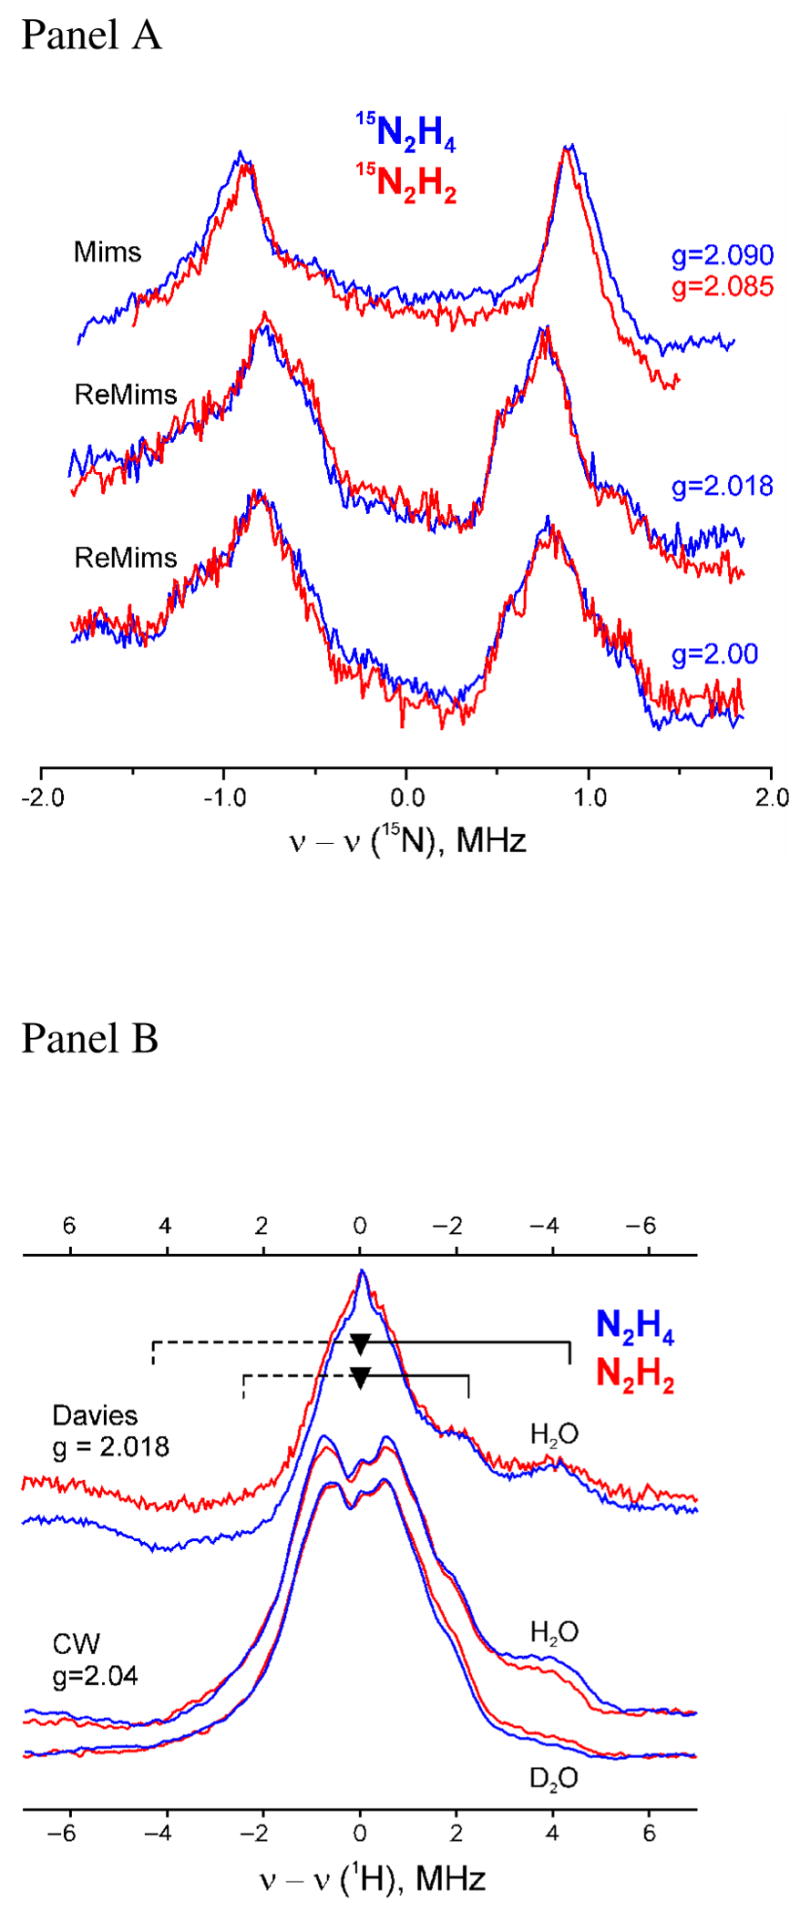
(Panel A) Comparison of pulsed 15N-ENDOR spectra for α-70Ala/α-195Gln MoFe protein trapped during turnover with diazene (red) or hydrazine (blue). Conditions: Mims sequence; π/2 = 52ns, τ= 300ns, RF 20μs, 50shots/point, 10scans, 2K, (N2H4) g = 2.09, 34.776 GHz, 20ms repetition rate, and (N2H2) g = 2.085−34.702 GHz, 10ms repetition rate. ReMims sequence; π/2 = 32ns, tau;1= 224ns, RF 20μs, 50 shots/point, 10ms repetition rate, 2K, (N2H4) 34.776 GHz, 20 scans, and (N2H2) 34.768 GHz, 40 scans. (Panel B) Comparison of pulsed and CW 1H ENDOR spectra for α-70Ala/α-195Gln MoFe protein trapped during turnover with diazene (red) or hydrazine (blue) in H2O and D2O buffers. Resolved hyperfine couplings to exchangeable (8.5 MHz) and non-exchangeable (4.5 MHz) proton(s) are indicated by braces; the asymmetry of the spectra reflect relaxation effects. Conditions: Davies: g = 2.018, π/2 =40ns, τ = 560ns, RF 40μs, 50 shots/point, 10ms repetition rate, (N2H4) 34.712GHz, 18 scans and (N2H2) 34.730GHz, 30 scans; CW ENDOR: 35.071 – 35.129GHz, modulation amplitude = 1.3 G, time constant = 64ms, RF sweep speed = 1 MHz/sec, bandwidth of RF broadened to 100kHz, 2K.