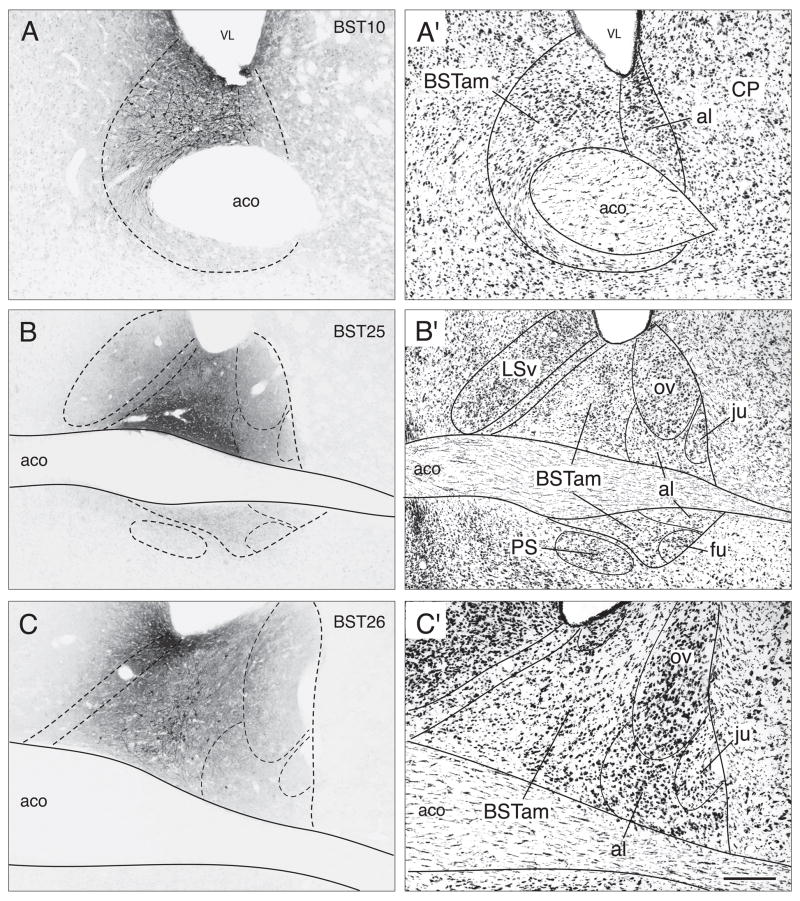
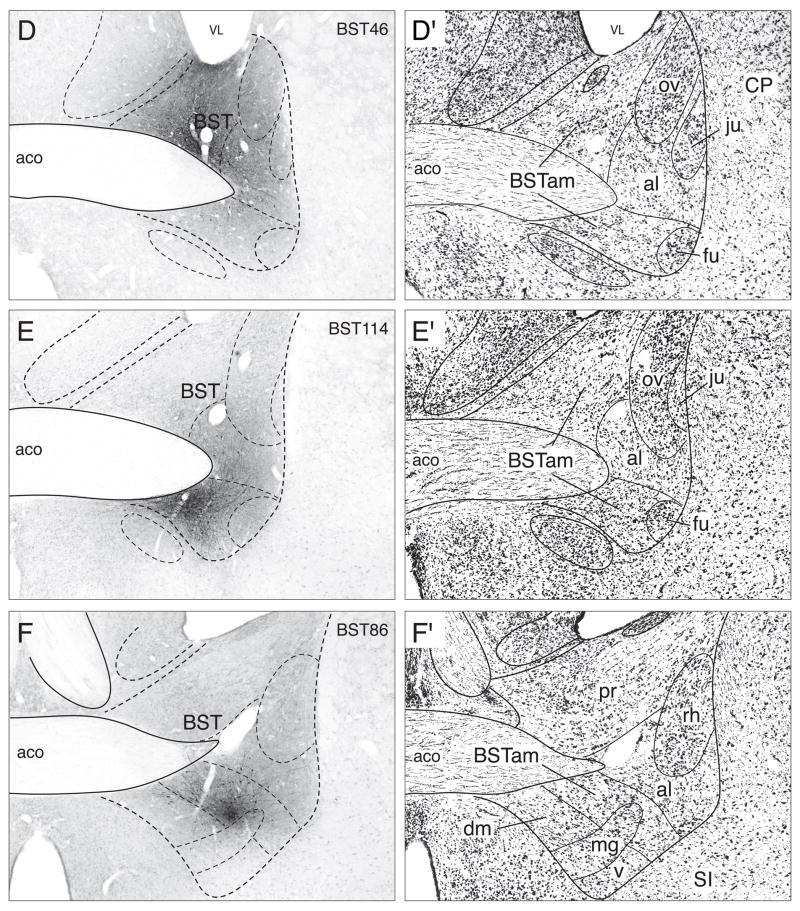
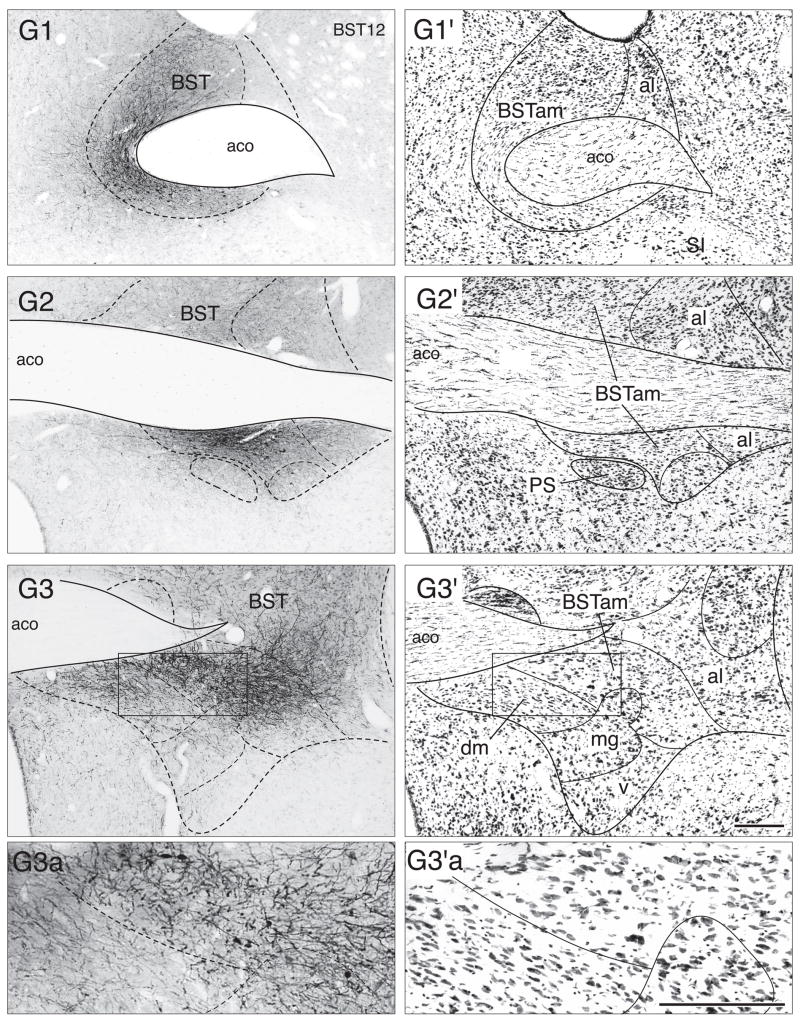
Fig. 2.
Brightfield photomicrographs to show the appearance of a PHAL injection site centered in the rostral region (A, experiment BST10), central core (B, experiment BST25), and caudal region (C, experiment BST26; and D, experiment BST46) of the dorsal BSTam; and a PHAL injection site centered in various rostrocaudal regions of the ventral BSTam (E, experiment BST114; F, experiment BST86; and G, experiment ACB12). The PHAL injection in experiment BST25 involves the greatest extent of the dorsal BSTam (see Fig. 3 for cameral lucida drawings of PHAL-labeled neurons), whereas the PHAL injection in experiment ACB12 involves the greatest extent of the ventral BSTam. G1, G2, and G3 show three representative rostrocaudal levels of the PHAL injection in experiment ACB12. Note that PHAL-labeled dendrites of ventral BSTam neurons tend to remain within the area itself, and do not extend into adjacent regions of the BST dorsomedial nucleus (G3). G3a shows at higher magnification the boxed area in G3. For cytoarchitectonic comparisons an adjacent Nissl-stained section is shown to the right of each PHAL photomicrograph (A′ to G3′a). Different features of these injection sites are illustrated in Figures 1 and 3. All scale bars = 200 μm.


