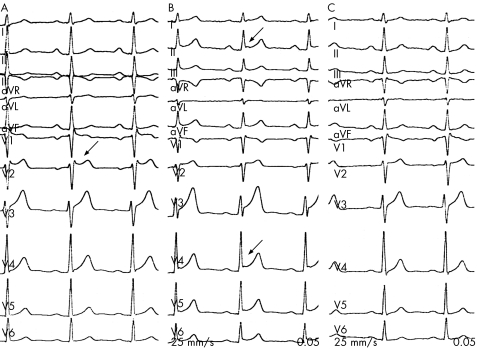
Figure 1 (A) The electrocardiogram (ECG) on presentation showing saddle‐back type ST‐segment elevation (ST‐SE; arrow) and incomplete right bundle branch block (RBBB). (B) The ECG taken several hours later shows widespread ST‐SE resembling early repolarisation (arrow). (C) Two days later, the ECG shows only incomplete RBBB.

An official website of the United States government
Here's how you know
Official websites use .gov
A
.gov website belongs to an official
government organization in the United States.
Secure .gov websites use HTTPS
A lock (
) or https:// means you've safely
connected to the .gov website. Share sensitive
information only on official, secure websites.
