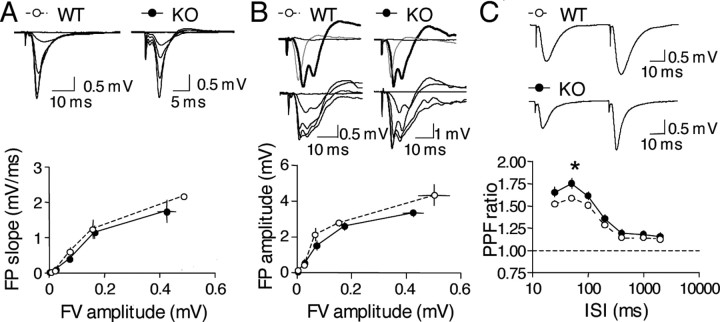
Figure 4.
Characterization of basal synaptic transmissionin BACE1 knock-outs. A, No change in AMPA receptor-mediated basal synaptic transmission in BACE1–/– mice. Input–output curves were generated by gradually increasing stimulus intensity and measuring the initial slope of the field potentials (FP) for BACE1+/+ mice (WT, open circles) and BACE1–/– mice (KO, filled circles) (left panel). The measured field potential slopes are plotted against the amplitude of presynaptic fiber volley, a measure of presynaptic action potentials. Example field potential traces taken at each stimulation intensities are shown for both BACE1+/+ mice and BACE1–/– mice on the right side. B, Normal NMDA receptor-mediated basal synaptic transmission in BACE1–/– mice. Pharmacologically isolated NMDA receptor-mediated synaptic transmission was measured by generating input–output curves at different stimulation intensities. NMDA receptor-mediated field potential amplitudes are plotted against the amplitude of presynaptic fiber volley for both BACE1+/+ mice (open circles) and BACE1–/– mice (KO, filled circles), as shown in the bottom panel. Example field potential traces are shown in the top panel. Top two traces show the pharmacological isolation of NMDA receptor-mediated responses in BACE1+/+ mice and BACE1–/– mice. Gray traces are AMPA receptor-mediated responses recorded in normal ACSF. Thick black traces are field potentials after switching to ACSF with 0 mm Mg2+ and 10 mm NBQX to isolate NMDA receptor-mediated responses. At the end of all experiments, 100 μm APV was added, which completely blocked the NMDA receptor-mediated field potentials (thin black traces). The bottom two traces show input–output curves of NMDA receptor-mediated field potentials from BACE1+/+ mice (left) and BACE1–/– mice (right). C, An increase in PPF ratio in the BACE1–/– mice. PPF ratio was measured at different ISIs, as shown in the bottom panel. Example field potential traces taken at an ISI of 50 ms are shown for both BACE1+/+ mice and BACE1–/– mice in the top panel.

