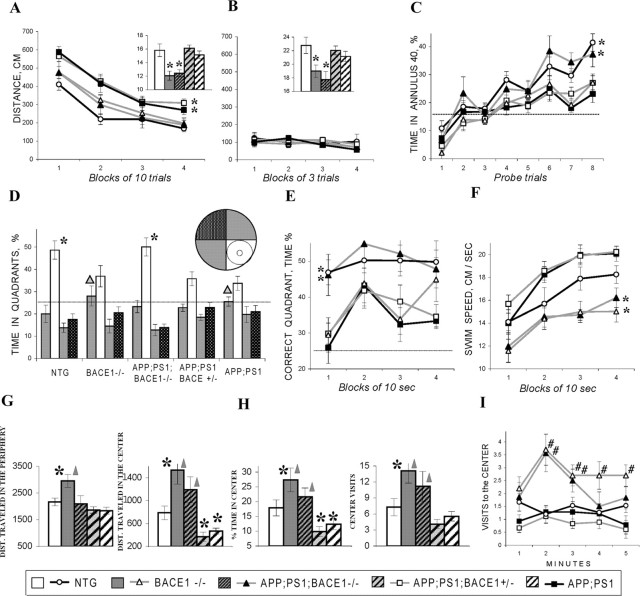
Figure 6.
Analyses of cognitive and emotional behaviors in aged BACE1–/–, APPswe;PS1ΔE9, and APPswe;PS1ΔE9;BACE1–/– mice. A–F, Cognitive deficits present in aged (16–18 months) BACE1–/– and APPswe;PS1ΔE9 mice but absent in APPswe;PS1ΔE9;BACE1–/– mice. Distance to find the platform is shown for consecutive blocks of “platform” trials in which the platform was available but hidden under the milky water (A). Inset shows an average swimming speed during platform trials. Note that BACE1–/– and APPswe;PS1ΔE9;BACE1–/– mice swam significantly slower than all other groups. No between-group differences were observed in distance to find the platform when it was made visible by a high-contrast extension (B). Inset shows that BACE1–/– and APPswe;PS1ΔE9;BACE1–/– mice swim slower than other groups similar to that observed in hidden platform trials (see A). Spatial preferences for the hidden platform location tested in the “probe” trials (C–F) in which the platform was lowered and inaccessible for the mouse for a variable interval (30–40 s). Acquisition of spatial preference is shown as a percentage of time spent in annulus 40 in consecutive probe trials (C) conducted before and after each block of 10 platform trials (shown in A). Nontransgenic controls and APPswe;PS1ΔE9;BACE1–/– mice acquired significantly higher preference for the platform location compared with all other groups. Percentage of time spent in different quadrants of the water maze during the last probe trial (D). Inset in D shows the scheme of quadrants in the water maze. The small circle indicates the location of the hidden platform, and the larger circle shows a borderline of annulus 40, an area of 40 cm in diameter centered around the platform. Nontransgenic and APPswe;PS1ΔE9;BACE1–/– mice swam predominantly in the correct quadrant (white bars), whereas the spatial preferences in other groups were significantly lower and distributed between the correct and one of the adjacent (gray bars) quadrants. The triangles indicate that the preferences for the correct and one of the adjacent quadrants are not different (p > 0.2). Preference for the correct quadrant is shown in consecutive blocks of 10 s in the last probe trial (E). The spatial preferences were stable in nontransgenic and APPswe;PS1ΔE9;BACE1–/– mice but not in other groups. In all genotypes, swim speed increased in the course of the probe trial (F). BACE1–/– and APPswe;PS1ΔE9;BACE1–/– mice swam consistently slower than other groups (see also insets in A and B). The asterisks in A and C–F indicate a significant difference from other groups as determined by Newman–Keuls post hoc test applied to a significant effect of group (ANOVA, p < 0.05). Dotted lines in C–E show chance levels of performance for the variables used. G–I, Anxiolytic phenotypes present in BACE1–/– and APPswe;PS1ΔE9; BACE1–/– mice in the open-field test. Integral measures of activity (G) and anxiety (H) averaged for whole duration of testing (5 min) is shown. The asterisks and triangles indicate a significant difference from nontransgenics (NTG) and APPswe;PS1ΔE9 mice, respectively, as a result of Newman–Keuls post hoc test applied to significant effect of group (ANOVAs, p < 0.01). Note that BACE1–/– and APPswe;PS1ΔE9 mice had contrasting deficits in distance, time, and number of visits to the central part of the open field, indicating low and high anxiety levels, respectively. Dynamics of visits to the central part of the open field (I) are shown for consecutive minutes of testing. Pound signs indicate significant differences from nontransgenic group as a result of Newman–Keuls post hoc test (p < 0.05) applied to significant group × minute interaction (ANOVA, F(16,252) = 1.75; p < 0.05).

