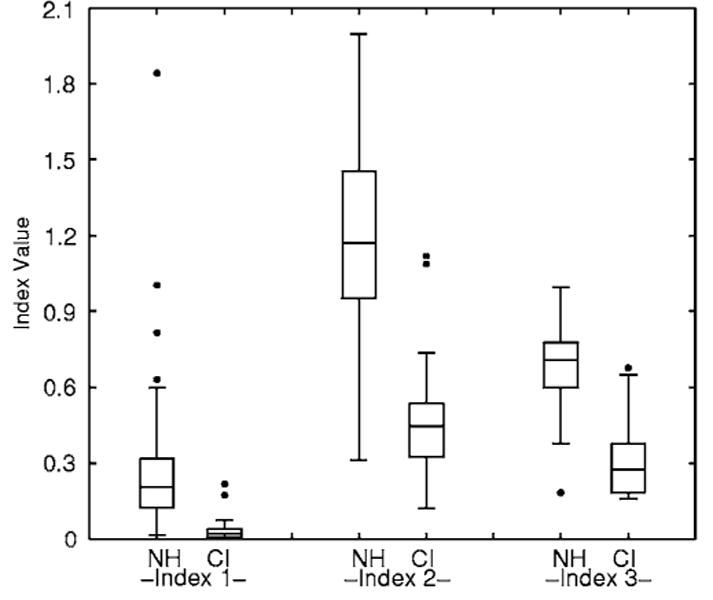
FIG. 3.

Box plots of the values of three indices (from left to right) for the NH and CI groups. Each box depicts the lower quartile (Q1), median, and upper quartile (Q3). The whiskers show the range of the rest of the data. The outliers plotted with filled circles are data points that fall more than 1.5 box-lengths (Q3–Q1) away from the lower or upper quartile.
