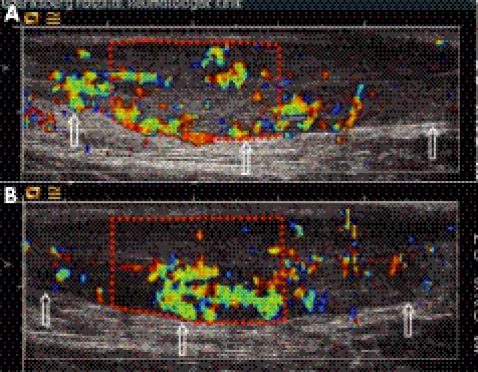
Figure 4 Colour Doppler grading before treatment and after six months of follow up. Longitudinal images of an Achilles tendon with proximal oriented left. The anterior borders of the tendons are indicated with arrows. For illustration, the region of interest has been added (red dotted line) and gives a value of 33% in (A) (before treatment) and 45% in (B) (at follow up). The centre of the maximum Doppler activity defines the centre of the ROI, which extends 1 cm proximally and distally.

An official website of the United States government
Here's how you know
Official websites use .gov
A
.gov website belongs to an official
government organization in the United States.
Secure .gov websites use HTTPS
A lock (
) or https:// means you've safely
connected to the .gov website. Share sensitive
information only on official, secure websites.
