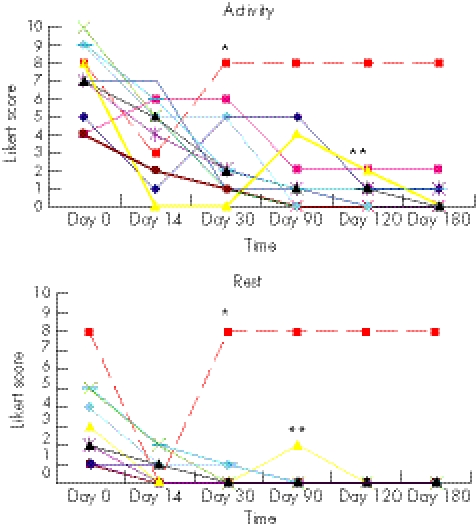
Figure 5 Pain during follow up shown on a Likert box score in the 11 patients. The graphs illustrates the outcome on the Likert box scale for each patient (coloured line) during activity (A) and at rest (B). *The red dotted line indicates the patient who dropped out at the 30 day follow up. The thick black line shows development in median Likert score. **The yellow line indicates a patient who experienced relapse of his symptoms because he returned too fast to full training load and ran 20 km three days in a row. He recovered on conservative treatment.

An official website of the United States government
Here's how you know
Official websites use .gov
A
.gov website belongs to an official
government organization in the United States.
Secure .gov websites use HTTPS
A lock (
) or https:// means you've safely
connected to the .gov website. Share sensitive
information only on official, secure websites.
