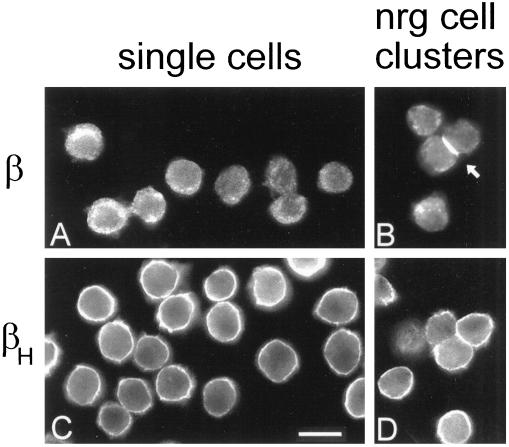
Figure 3.
Distinct distributions of two β spectrin isoforms in Drosophila tissue culture cells before and after expression of neuroglian and formation of cell–cell contacts. Control S2 cells (A and C) and neuroglian-expressing S2 cell aggregates (B and D) were attached to microscope slides and stained with antibodies against β spectrin (A and B; 1:500 serum) or βH spectrin (C and D; 5 μg/ml) followed by FITC-conjugated secondary antibody. Arrowhead marks the accumulation of β spectrin at a cell–cell contact. Bar, 10 μm.

