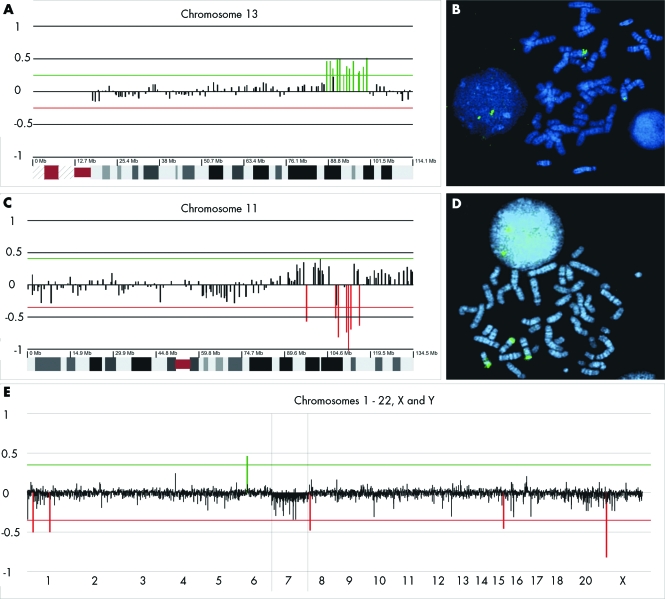
Figure 2 Cytogenetic analysis of patient 16 (panels A and B), patient 14 (panels C and D) with segmental chromosomal mosaicisms, and patient 9 (panel E) with a mosiacism monosomy of chromosome 7. (A) Partial molecular karyotype enlarging the ratio profiles for chromosome 13; in the x axis clones are ordered from the centromere to the q‐arm telomere, and the y axis shows the log2 transformed intensity ratios at each locus. Red lines indicate the threshold for clone deletion or duplication (±4*SD). (B) Fluorescence in situ hybridisation (FISH) with PAC 1091O16 confirmed that the duplication at 13q32The duplication was present in 60% of the cultured lymphocytes. (C) Partial molecular karyotype enlarging the ratio profiles for chromosome 11. On the x axis clones are ordered from the p‐arm telomere to the q‐arm telomere and the y axis shows the log2 transformed intensity ratios at each locus. Red lines indicate the threshold for clone deletion or duplication (±4*SD). (D) The duplication at 11q24.3 was confirmed with clone BAC 744N12 and was the result of a translocation between 11q and 9q. FISH on cultured and uncultured lymphocytes showed the duplication to be present in, respectively, 6% and 25% of the cells. (E) Molecular karyotype showing the ratio profiles for the chromosomes 1 to 22, X, and Y. Chromosome 7 is positioned between the two vertical lines, and shows log2 transformed intensity ratios with an average of −0.05.

An official website of the United States government
Here's how you know
Official websites use .gov
A
.gov website belongs to an official
government organization in the United States.
Secure .gov websites use HTTPS
A lock (
) or https:// means you've safely
connected to the .gov website. Share sensitive
information only on official, secure websites.
