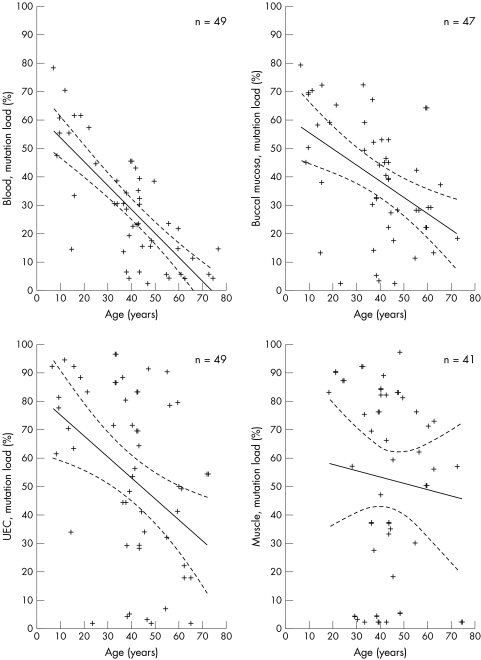
Figure 2 Correlation between the age of subjects and the mutation load (heteroplasmy) in blood, buccal mucosa, urine epithelial cells (UEC), and skeletal muscle. Each cross represents a subject; n = number of subjects. Solid line designates Spearman's correlation coefficient line. Dotted line designates the 95% confidence intervals.

An official website of the United States government
Here's how you know
Official websites use .gov
A
.gov website belongs to an official
government organization in the United States.
Secure .gov websites use HTTPS
A lock (
) or https:// means you've safely
connected to the .gov website. Share sensitive
information only on official, secure websites.
