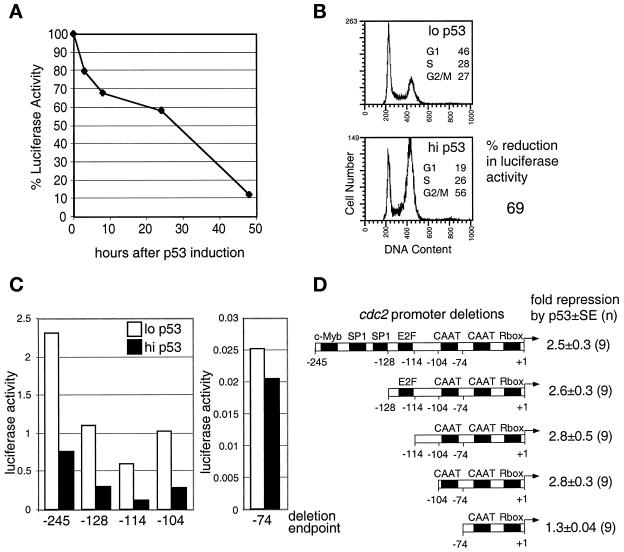
Figure 6.
Effect of p53 overexpression on cdc2 promoter activity. TR9-7 cells were transfected with cdc2 promoter–luciferase constructs. Pools of clones containing stably integrated reporter constructs were tested for repression by p53. The pools were incubated without tetracycline to induce p53, and the luciferase activity was measured and corrected for protein concentration (MATERIALS AND METHODS). (A) cdc2 promoter activity after removal of tetracycline from asynchronous cultures. Luciferase activity is shown relative to the activity at the beginning of the experiment. (B) Cell cycle distribution and cdc2 promoter activity in cells arrested in G2 by p53. Cells were incubated for 48 h in mimosine and then for 16 h in the presence (lo p53) or absence (hi p53) of tetracycline in the continued presence of mimosine. Mimosine was removed, cells were incubated for 72 h in the presence or absence of tetracycline, and the cells were analyzed for cell cycle position and luciferase activity; % reduction is the level of luciferase activity in the absence of tetracycline relative to the level in the presence of tetracycline. (C) Deletion mapping of the cdc2 promoter. Deletion constructs containing various lengths of the promoter linked to luciferase were transfected into TR9-7 cells. Pools of stable clones were arrested with mimosine for 48 h and incubated in the absence of mimosine in the presence or absence of tetracycline for 72 h. Luciferase activity, corrected for protein concentrations of cell lysates in a typical experiment, is shown. (D) Diagram of the cdc2 promoter. Known and predicted DNA-binding elements are shown (Sugarman et al., 1995). The fold repression and SEs from the indicated number (n) of replicate samples are shown. Similar patterns of repression were observed in at least three independent experiments.

