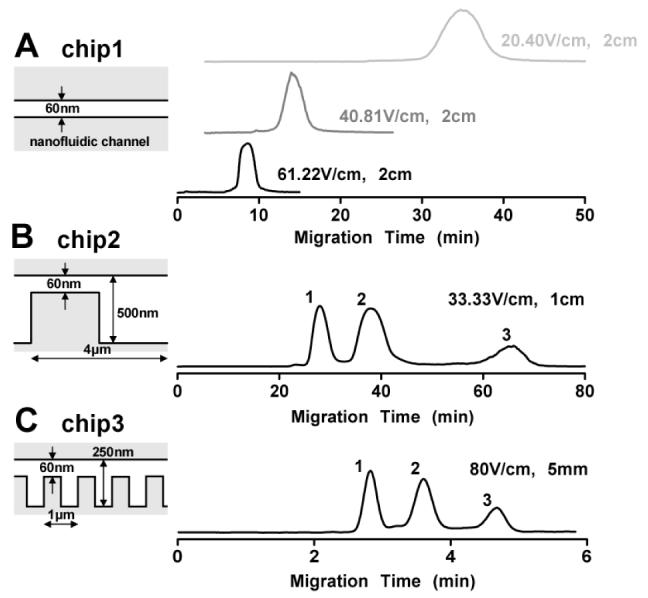
FIG. 3.

Comparison of separation performance in three different nanofluidic chips. Chip1 has only a 60nm thin, flat channel without any nanofilter. Chip2: ds=60nm, dd=560nm, L=4μm; Chip3: ds=60nm, dd=300nm, L=1μm. Band assignment is the same as in Fig. 2 for SDS-protein complexes. The separation lengths and the applied fields are indicated in the figures.
