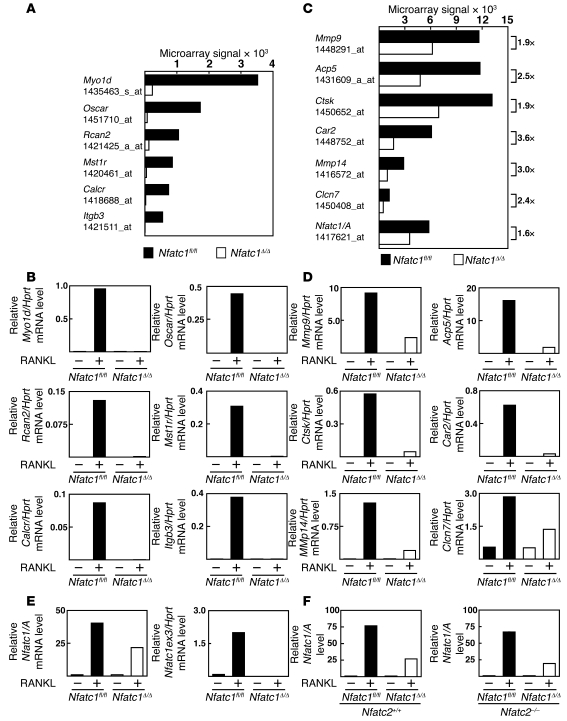
Figure 4. Comparative microarray analysis reveals 2 sets of NFATc1-regulated genes in osteoclasts.
(A) Microarray signal intensities for selected NFATc1-dependent mRNAs from Nfatc1fl/fl and Nfatc1Δ/Δ MROcPs. (B) qRT-PCR analysis for the expression of the NFATc1-dependent mRNAs identified in A in Nfatc1fl/fl and Nfatc1Δ/Δ BMOcPs stimulated with M-CSF or M-CSF and RANKL for 3 days. (C) Microarray signal intensities for selected NFATc1-augmented mRNAs from Nfatc1fl/fl and Nfatc1Δ/Δ MROcPs. (D) qRT-PCR analysis for the expression of the NFATc1-augmented mRNAs identified in C in Nfatc1fl/fl and Nfatc1Δ/Δ BMOcPs stimulated with M-CSF or M-CSF and RANKL for 3 days. (E) qRT-PCR analysis for the expression of the Nfatc1 mRNA isoforms in Nfatc1fl/fl and Nfatc1Δ/Δ BMOcPs stimulated with M-CSF or M-CSF and RANKL for 3 days. PCR primers targeted the deleted exon (Nfatc1ex3) or the Nfatc1/A isoform (see Table 1). Note that the qRT-PCR analyses presented in B, D, and E were performed on the same mRNA samples and are representative of at least 2 independent experiments. (F) qRT-PCR analysis for the expression of Nfatc1/A mRNA in NFATc2 sufficient (Nfatc2+/+) and deficient (Nfatc2–/–) Nfatc1fl/fl and Nfatc1Δ/Δ BMOcPs stimulated with M-CSF or M-CSF and RANKL for 4 days. The data in F are representative of at least 2 independent experiments.

