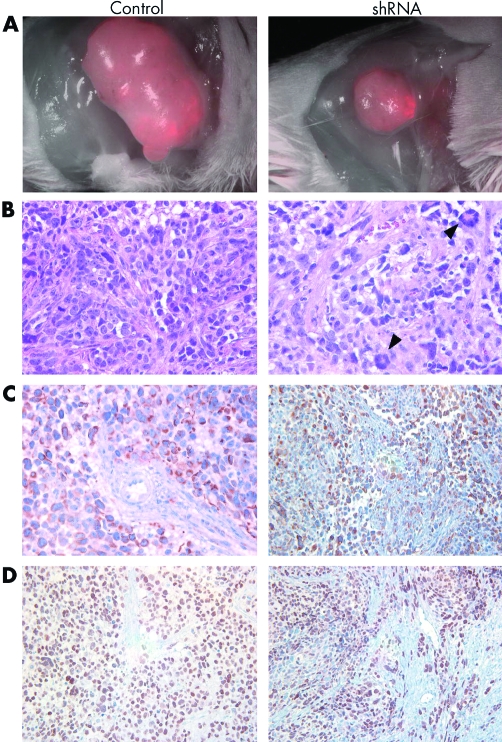
Figure 6 Histology of RMS xenografts. Mice from control and shRNA treated groups were euthanised at the completion of the study. (A) Tumours were visualised for their red fluorescence using a Leica stereoscope equipped with a fluorescent light source at a magnification of ×7.5. (B, C, D) Resected tumours were fixed and paraffin embedded for histological analysis. (B) H&E staining of tumour sections demonstrating the increased incidence tumour giant cells as a result of cytokinesis defects in shRNA treated tumours (arrowheads). (C, D) Myogenic markers desmin (C) and myoD (D) expressed in human RMS xenografts.

An official website of the United States government
Here's how you know
Official websites use .gov
A
.gov website belongs to an official
government organization in the United States.
Secure .gov websites use HTTPS
A lock (
) or https:// means you've safely
connected to the .gov website. Share sensitive
information only on official, secure websites.
