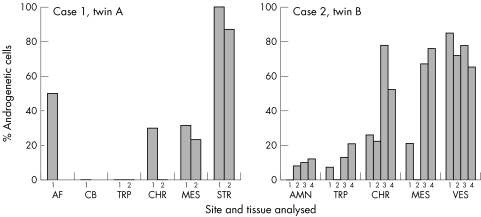
Figure 2 Distribution of androgenetic cells within each placenta. The estimated proportion of androgenetic cells is given for tissues isolated from two separate biopsy sites from case 1 and four biopsy sites from case 2. This proportion is estimated from the allele peak ratios for markers for D7S691, which was informative in both cases, had clearly separated bands and no evidence for allelic amplification bias. Only those samples with an estimate of <10% androgenetic cells (case 2: amnion 2, amnion 3, and trophoblast 1) did not show a consistent bias with all tested markers. The frequency of the “LL” genotype from cultured cells is used for the estimates in the amniotic fluid and stroma samples for case 1. AF, amniotic fluid; AMN, amnion; CB, cord blood; CHR, chorionic membrane; MES, chorionic mesenchyme; STR, stroma, derived from cultured chorionic villi; TRP, trophoblast; VES, enlarged chorionic vessel.

An official website of the United States government
Here's how you know
Official websites use .gov
A
.gov website belongs to an official
government organization in the United States.
Secure .gov websites use HTTPS
A lock (
) or https:// means you've safely
connected to the .gov website. Share sensitive
information only on official, secure websites.
