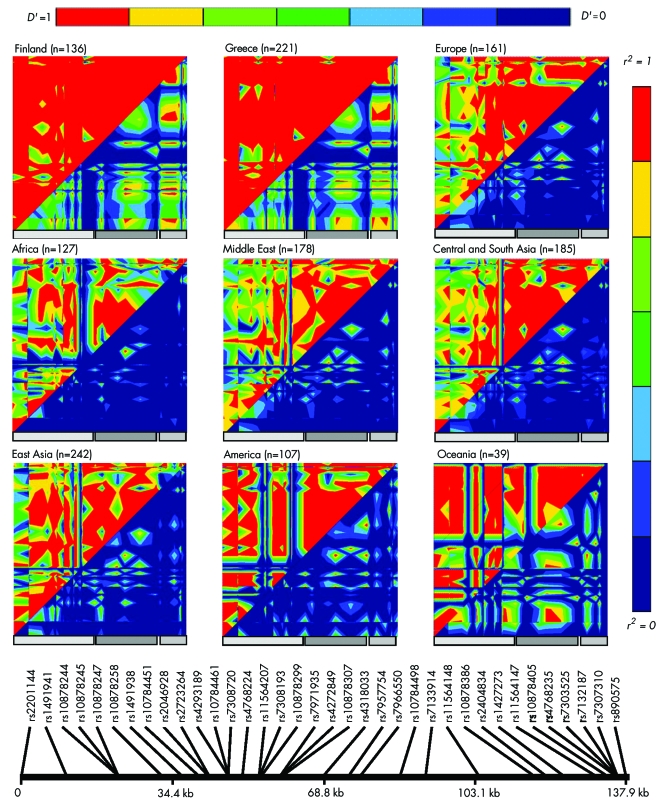
Figure 2 Graphical Overview of Linkage Disequilibrium (GOLD) plots showing linkage disequilibrium in diverse ethnic populations. Pairwise LD analysis was performed using EMLD; D′ is shown in the upper left, r2 in the lower right. Non‐informative markers were removed prior to calculations. Grey bars indicate the position of the three haplotype blocks originally defined by Tagit using Caucasian data from www.hapmap.org.

An official website of the United States government
Here's how you know
Official websites use .gov
A
.gov website belongs to an official
government organization in the United States.
Secure .gov websites use HTTPS
A lock (
) or https:// means you've safely
connected to the .gov website. Share sensitive
information only on official, secure websites.
