Figure 4.
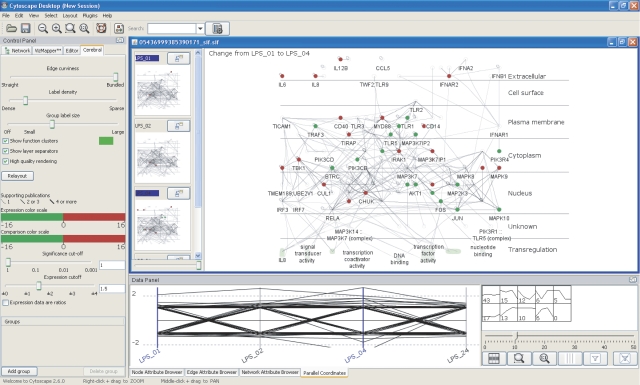
Cerebral enables the overlay of quantitative data in a molecular interaction network context. To facilitate the side-by-side comparison of specific experimental conditions, Cerebral uses a series of small, linked views to visualize quantitative data (gene expression values, for example) across multiple conditions simultaneously, alongside a larger central window, which permits more detailed investigation of particular conditions or regions of the network. Nodes (i.e. molecules) are colored according to user-defined thresholds of fold change in gene expression (red, significantly upregulated; green, significantly downregulated). The small multiple windows and the larger overview window are linked––if one zooms in or out, pans, mouses over or selects a node in one of the views, the same action will be perpetuated across all views. By selecting one of the small multiple windows, the expression values for that condition will be promoted to the larger overview window. If two small multiple windows are selected simultaneously, the difference in gene expression in the two conditions is computed and displayed in the main window. In this view, the nodes in the main window are colored according to the magnitude of the change between the two conditions. InnateDB uses the number of pieces of evidence supporting an interaction, usually separate publications or experiments, as a measure of confidence in the interaction. Cerebral uses weighted lines in its display to represent these confidence scores (heavier weighted lines=higher confidence). By right clicking on a node or edge, one may interactively link to the relevant pages in InnateDB for more detailed annotation regarding the gene, protein or interaction of interest.

