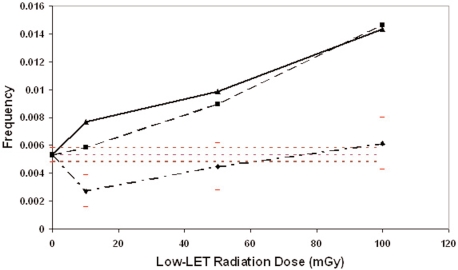
FIGURE 1.
Dose-response curves for the frequency of micronucleated cells after exposure of human lymphocytes to photon radiations with different energy characteristics: Gamma rays (diamonds); 70-kVp X rays (squares); 250-kVp X rays (triangles). Horizontal dashed lines indicated the 95% confidence region for the pooled control data. Error bars for data points are 95% confidence intervals.

