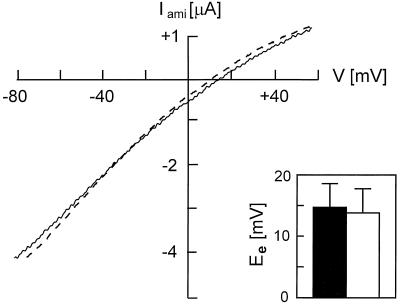
Figure 6.
Macroscopic current–voltage relationship of XENaCF expressed alone or together with XK-Ras2AG12V in Xenopus oocytes. Macroscopic Iami was measured in ND96 solution in dependence of a voltage ramp at 100 mM extracellular Na+. Representative traces for XENaCF and XENaCF + XK-Ras2AG12V–injected oocytes are shown as straight and dotted lines, and mean equilibrium potential (Ee) is shown as black and white bars (n = 5), respectively.

