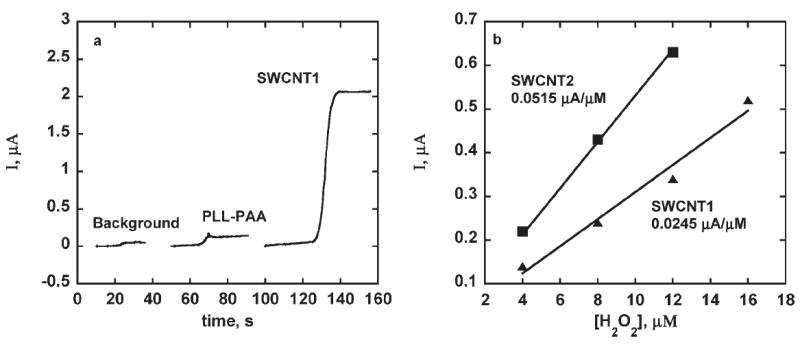
Fig. 2.

a) Amperograms at −0.3 V vs. SCE from injection of 40 μM H2O2 for sensors in 0.1 mM H2Q in PBS rotated at 2000 rpm for. 50 pmol mL−1 biotin-HRP (Ag): A) background PLL-PAA-Ab, no Ag, B) PLL-PAA-Ab-Ag, C) SWCNT1 sensor assembly (see Sec. 2). b) Amperograms showing effect of hydrogen peroxide concentrations on steady state currents obtained with sensor assemblies made with 0.5 mg mL−1 Ab. Conditions: 2000 rpm, 0.1 mM H2Q, 4 μM H2O2, 50 pmol mL−1 biotin-HPR.
