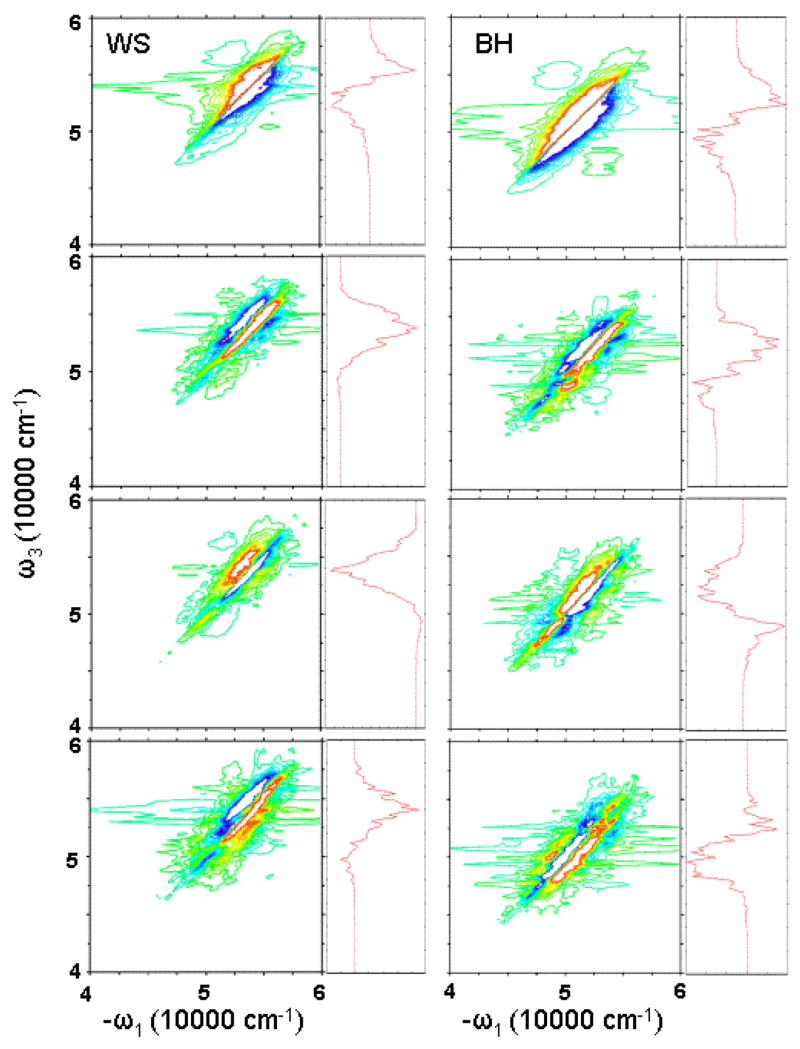
FIG. 8.

Simulated 2D photon echo signals. Left column: WS model; right column: BH model. From top to bottom, imaginay part of xxxx(zzzz), and real part of xxxy(zzzz), xxxy(zyy¯z¯), and xxyz(zzxx). Maximum peak is truncated at 20% to better show the weaker feartures. Right marginals: diagonal cut of the 2D spectra. The same color scale is used as in Fig. 7.
