. 2008 Feb 27;57(8):1041–1048. doi: 10.1136/gut.2007.143339

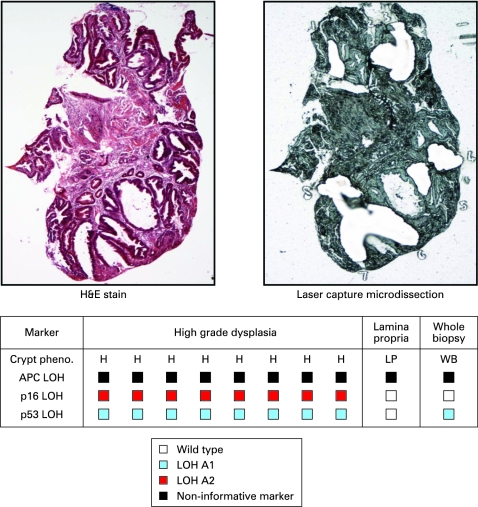
Figure 2. Oesophageal biopsy clonal map. Individual crypts, squamous islands and areas of lamina propria were microdissected from oesophageal biopsies and analysed for tumour suppressor gene loss of heterozygosity (LOH). An unstained serial section of the whole biopsy was then scraped into proteinase K using a clean scalpel blade, and the lysate analysed. LOH of individual alleles is denoted by a blue- or red-coloured box. The table is the clonal map obtained from a single biopsy and each column within the table represents genetic analysis of a single crypt or area of lamina propria. In each case the shortest allele is referred to as A1 and the longest A2. Non-informative markers are denoted by a black box. Individual crypts often demonstrated LOH not detectable on the whole biopsy section lysate probably as a consequence of a diluting effect of wild-type stroma in the whole biopsy lysate. Other biopsy clonal maps are presented in the supplementary information (supplementary fig 1). H&E, haematoxylin & eosin.

Figure 2