. 2008 Apr 16;57(8):1065–1072. doi: 10.1136/gut.2007.145839

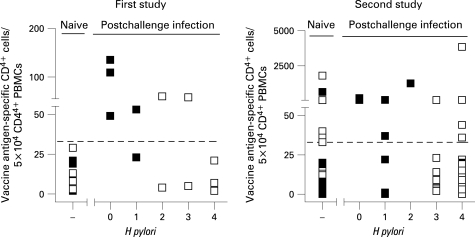
Figure 4. H pylori-specific CD4+ T cell response is negatively correlated with H pylori infection. Numbers of antigen-specific CD4+ T cells per 5×10⁴ CD4+ cells detected after short-term in vitro stimulation of 106 peripheral blood monocytic cells (PBMCs) obtained before (denoted by naive) and 6 weeks after challenge infection (see supplementary table 6 for exact values) of urea breath test (UBT) (▪) and UBT+ (□) volunteers were plotted against the overall H pylori score (tables 1 and 2). Stippled lines indicate thresholds (mean of prevaccination values + 3SD = 33 and 32 in the first and second study, respectively) for significant numbers in specific—that is, cytokine-producing, CD4+ T cells. In the left-hand panel (first study), y-values represent interferon γ (IFNγ)+, β7+, CD4+ T cell numbers responding against H pylori urease protein. In the right-hand panel (second study), y-values indicate β7+, CD40L+, interleukin2 (IL2)+ CD4+ T cell numbers responding to H pylori urease and/or HP0231 representing peptide pools. Fisher exact test p values that CD4+ T cell responder proportions were not similar in UBT and UBT+ groups were: first study p = 0.103, second study p = 0.004, cumulated, p<0.001).

Figure 4