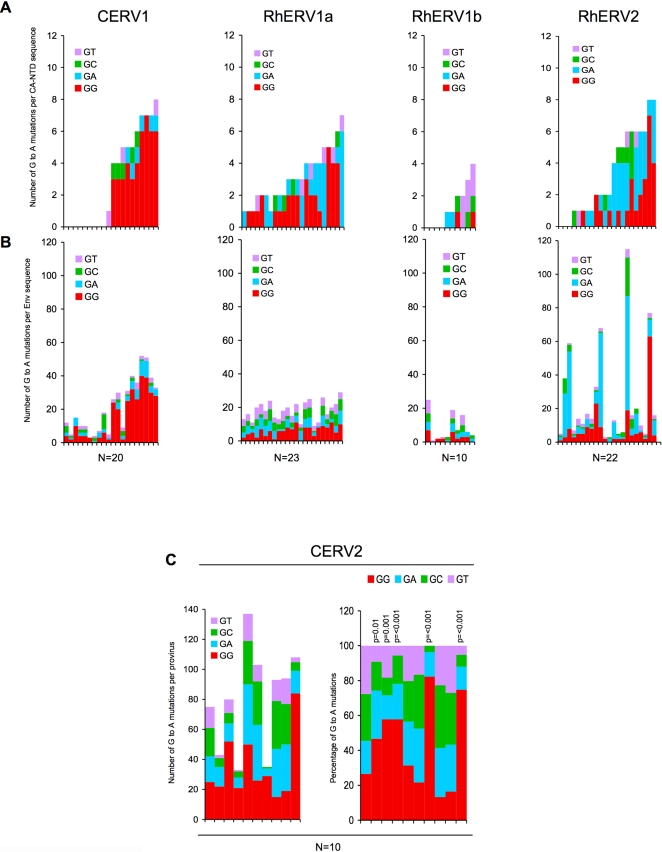
Figure 4. Analysis of G to A changes in CA-NTD and Env sequences in primate gamaretroviruses.
A) CA-NTD sequences from the primate gamaretroviruses were selected according to whether an unambiguously linked Env sequence could be retrieved from the genome database. In the case of CERV1, ten sequences that lacked G to A changes and ten sequences that had four or more G to A changes were selected. For each virus species, each sequence is plotted as a bar graph (one bar for each provirus) and color-coded according to dinucleotide context (ie the nucleotide in the +1 position relative to each G to A change; red = GG to AG, cyan = GA to AA, green = GC to AC, magenta = GT to AT). The CA NTD sequences are arranged from left to right in order of increasing numbers of total G to A changes in CA-NTD sequences (upper panels). B) The same analysis was performed for the linked env sequences (lower panels), which are arranged in the same order (left to right) according to the linked CA-NTD sequence. C) All ten CERV2 proviral sequences were analyzed and the dinucleotide context in which G to A mutations occurred is plotted and color-coded as in A (left) panel. Additionally, The percentage of G to A changes in each dinucleotide context relative to consensus sequence is plotted, and normalized according to the dinucleotide composition of the consensus sequences (right panel). The p-values for deviation from a random distribution were calculated using the chi-squared test. Proviruses 1, 4, 6 and 7 are complete.

