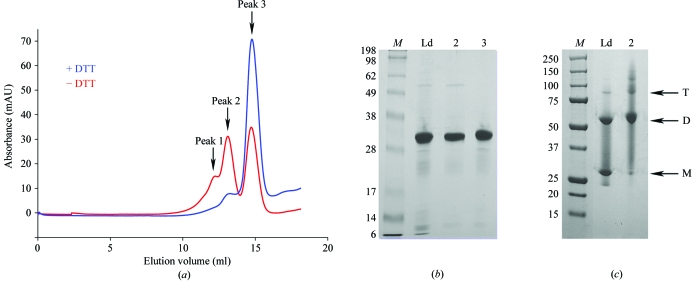
Figure 1.
A redox-dependent dimer. (a) Elution diagram of MtNAS in a gel-filtration experiment (Hiload 10/30 Superdex 200, GE Healthcare). The red curve represent the elution diagram without reducing agent whereas the blue curve is the elution diagram obtained after the addition of 10 mM DTT to the sample and elution buffer. The first peak on the red and blue curves corresponds to small amount of trimer and dimer, respectively. (b) SDS–PAGE gel (10%) of purified fractions of MtNAS with reducing agent. (c) SDS–PAGE gel (10%) of purified fractions of MtNAS without reducing agent. Lane M, molecular-weight markers (kDa). Lane Ld, sample loaded onto size-exclusion chromatography after Ni–NTA purification. Lane 2, sample collected from the second peak. Lane 3, sample collected from the third peak. T, trimer. D, dimer. M, monomer.

