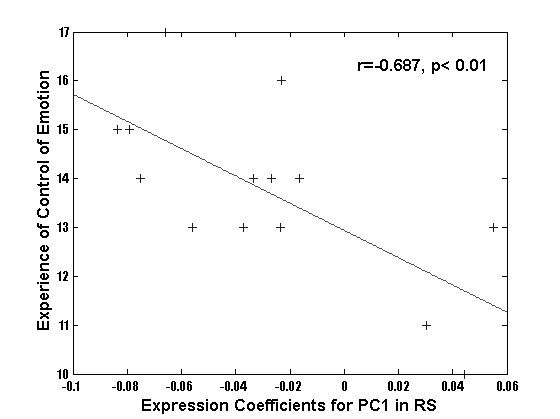
Figure 5.

Regression plots of expression coefficients of PC1 with data of the test scores of the 14 subjects highlighting the functional relevance of these PCs.

Regression plots of expression coefficients of PC1 with data of the test scores of the 14 subjects highlighting the functional relevance of these PCs.