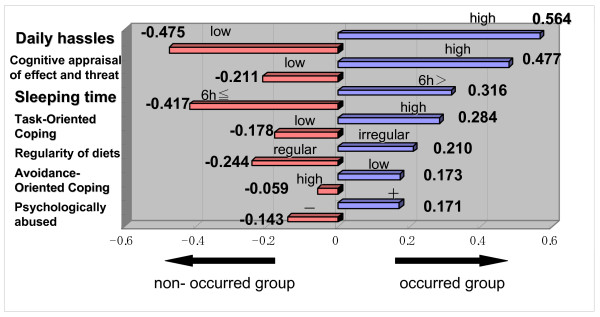
Figure 5.
Chart of category weight obtained from multivariate analysis for the occurrence and the non-occurrence group. To discriminate whether or not IBS had developed, seven explanatory variables were selected. A graph of category weight depending on the quantification method II (discriminate analysis) enabled extraction of patients who have developed IBS. This figure showed each of the factors predictive of onset in order of highest influence. Using the total of these discriminate coefficients as the predictive value, we estimated that subjects with positive predictive values had high risk of developing IBS, while those with negative predictive values had low risk of developing IBS. In our subjects, the ratio of predictive value was as high as 97/105 (92.38%).

