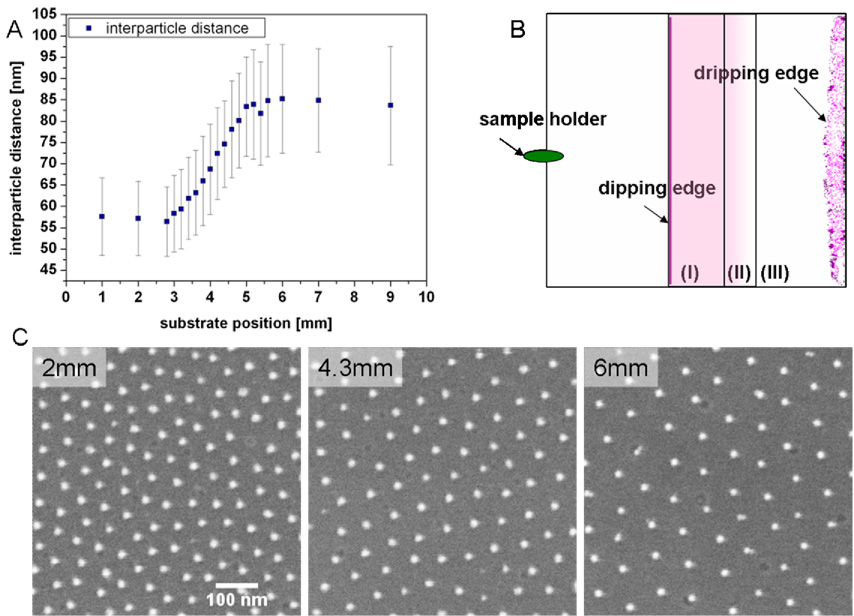
Fig. 1.
Nanoparticle spacing gradient surfaces. (A) Gradient sample with a 2 mm length from substrate position 3 mm to 5 mm which covers nanodot spacings ranging from ca. 55 nm to 85 nm. Each gold particle has a diameter of approximately 6 nm. Origin of the graph indicates the dipping edge as explained in (B). Error bars represent standard deviations (standard errors ~1 %). (B) Schematic drawing of the dip-coated substrates illustrating the differently patterned areas. (I) 3 mm homogenously nanopatterned area, small constant particle spacing; (II) 2 mm particle spacing gradient; (III) homogenously nanopatterned area, large constant particle spacing, including the dripping edge which displays an area of uncontrolled nanoparticle aggregation forming upon solvent drying. (C) Scanning electron microscopy pictures taken at different positions of the substrate: area (I) at position 2 mm, area (II) at position 4.3 mm and area (III) at position 6 mm.

