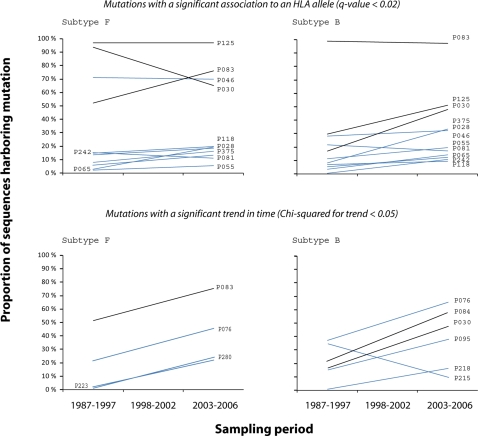
Figure 1. Trends in time of polymorphisms identified as potential CTL-escape mutations.
Trend lines for the 3-point in time prevalence estimated are shown (prevalence estimated at each time available in table S3). Mutations were classified according to viral subtype (Subtype F in left panel, subtype B in right panel), according to whether they were identified through statistical analysis (upper panel) or trend analysis (lower panel), and according to whether they were identified through negative (black) or positive (blue) ORs. Mutations at positions P30 and P83 are repeated on upper and lower panels as they were significantly associated to an HLA allele (q-value<0.2) and also shown a significant trend in time (Chi-squared for trend <0.05). Except for mutations on positions P30 on subtype F and P215 on subtype B, trends are toward an increase or a stable prevalence in time. Particularly, those that are at present the most common state (identified through negative OR, black lines) show the higher increase in time.

