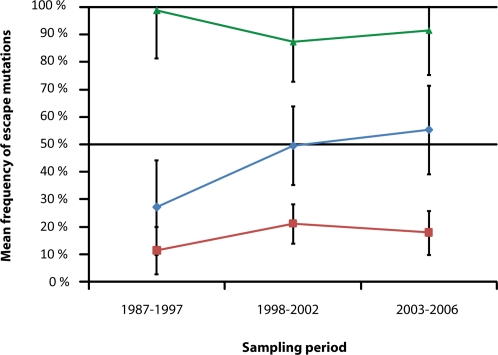
Figure 2. Mean frequency of escape mutations across time.
Percentage of sequences harboring the escape mutations are represented on the vertical axis. As there is no previous data available to know what mutations might dominate B or F subtype, classification of mutations had to be performed a-posteriori: Those found to dominate a viral subtype (green line) and the remaining according to whether they were identified through negative (blue line) or positive (red line) ORs. Groups compositions were as follow: red group = P028, P046, P055, P065, P081, P118, P242 and P375 in both subtype B and F; blue group = P030, P084 and P125 in subtype B and P083 in subtype F; green group = P030, P084 and P125 in subtype F and P083 in subtype B. Statistical analysis performed by GLM Repeated Measures showed that these three groups have had significantly different behaviors in time: escape mutations identified through positive associations have always remained in a low prevalence while those identified through negative associations (as they are now the most common state) have always dominated one of either B or F subtype, or been previously in a low prevalence and increased significantly in time until becoming the most prevalent state in the subtype they do not dominate. These trends suggest a convergence of viral subtypes mediated by HLA selection.

